P1 Garage @ Bucknell University
About P1
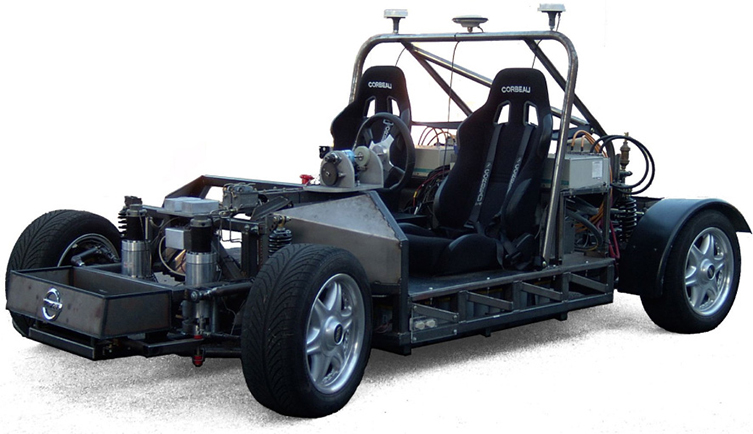
P1 is a student-built electric drive-by-wire vehicle owned and operated by Bucknell University. Originally built at Stanford University with funding from Nissan Motor Company, Ltd., P1 has been used for many research investigations including vehicle system diagnostics, stabilization at the limits of handling, control of high-sideslip (drift) maneuvers, lane-keeping assistance, road friction and state estimation. The actuation and instrumentation suites allow for many types of investigations with more flexibility than typically possible with instrumented production cars.
Dynamics
The dynamics of P1 match reasonably well with typical passenger cars or sport sedans, depending on the tire selection. The mass of the vehicle, despite the lack of body, as well as the wheelbase and track width fall within typical ranges for productin passenger vehicles. The only significant difference is that P1 has an atypically low yaw moment of inertia and a slightly larger roll moment of inertia. These atypical values are a result of the flat battery pack underneath the driver and passenger seats. Values for all of these dynamics are provide in the parameters section of this page. Experimental speeds up to approximately 30 m/s are possible given sufficient testing space.
Actuation
P1 has a unique set of actuators. The car is outfitted with an electric by-wire drivetrain comprised of two separate AC induction motors, each driving one of the rear wheels. Control of the motors is done separately, allowing for different torque commands to be provided to each. As a result, experiments with varying rear wheel torques can be accomplished. Similarly, the front steering is separated left/right with servomotors driving Pittman arms to steer the wheels. The highly responsive (up to 8 Hz while in motion) steering actuators can be controlled individual to generate desired steering angles on each wheel. Force-feedback can also be applied to the steering wheel.
Instrumentation
P1 is equipped with a Hemisphere VS330 dual-antenna GPS system
that provides position, velocity, and attitude data. To supplement the data from
the GPS, a custom-coded Kalman Filter is used to fuse measurements from a 6 DOF
MEMS IMU with the GPS data for a state update rate of 500 Hz. Additional data is
collected from wheelspeed sensors and load cells in tie rods/toe links at each
wheel as well as voltage and current measurements for each actuator. A pair of
Michigan Scientific LW9.5 wheel force transducers provide 6-axis tire force and
moment measurements. The wheel force transducers are provided ![]() though National Science Foundation MRI Grant
1726283.
though National Science Foundation MRI Grant
1726283.
Test Track Facilities
To take advantage of the capabilities of P1, Bucknell University has partnered with the Larson Transportation Institute at Penn State University to provide access to the LTI test track facility. This site features a 1-mile oval, a 400-foot handling area, and a vehicle durability-testing course.
Experiment with P1
Bucknell University is proud to operate a full-scale vehicle testbed and recognizes the challenges associated with vehicle experimentation. As a result, Bucknell invites researchers to propose research experiments that could be completed with P1 at Penn State LTI. If feasible, Bucknell and Penn State will invite researchers to join the research teams to complete the proposed experiments. A short proposal form is provided below.
Experiment proposal form
To initiate a request to use P1, please fill out the proposal form
and email to cbeal@bucknell.edu.
P1 Parameters
A parameter set is available for P1. These parameters are best-estimates based on model fits completed over the years. Sufficient parameters are included to model the vehicle with lateral, longitudinal, yaw, roll, and four wheel speed states.
P1 Parameter Script (MATLAB)The parameters can be obtained by opening MATLAB and running the
command p1_params. Upon completion, the best-estimate parameter set
will be loaded into the MATLAB environment. The parameters required for a simple
bicycle model representation of the vehicle are given in the table below.
Similarly, the suspension kinematics have been identified and are
provided in the form of lookup tables. Running sglu = p1_sglu; from
the MATLAB function linked above will generate the lookup tables in a variable
sglu which can then be used to determine the suspension kinematics
over a range of steering angles.
| Description | Parameter | Value | Units |
|---|---|---|---|
| Mass | m | 1724 | kg |
| Yaw Moment of Inertia | Izz | 1300 | kg-m2 |
| CG-Front Axle Distance | a | 1.35 | m |
| CG-Rear Axle Distance | b | 1.1 | m |
| Front Axle Cornering Stiffness | C_a_f | 75000 | N/rad |
| Rear Axle Cornering Stiffness | C_a_r | 135000 | N/rad |
Data Library
P1 has been used for many different experiments over the years.
The data from experiments performed since P1 was acquired by Bucknell University
is compiled in the following section. While certain experiments focus on data
from specific sensors, each data set includes data from all sensors on the car.
The format is a MATLAB data file which loads with 5 variables. The
info variable is a structure which contains basic information about
the testing. It includes the date and location of the testing, notes entered by
the researchers who conducted the experiment, and car software version
information. The TET variable contains debug information for the
on-board computer and is typically not needed. The DataDescription
variable is another struct that describes the data. While this can change
depending on the particular test, the typical structure is described in the
table below. The DataDescription variable is the key to unpacking
the y variable, which is a matrix with a column for each signal and
a row for each time step. The columns of y are arranged in order of
the DataDescription variable. Finally, a time vector t
is provided with a length matching the number of rows in y.
The signals in y can be broken up into submatrices as described
by DataDescription by running the script names
provided below. This script also relies on the dependency
extractdata also provided below.
Description of Signals
| Field | Size | Units | Description |
|---|---|---|---|
| Steering | 12 signals | rad, rad, amps, amps, volts, volts, rad, rad, ticks, ticks, volts, volts | Contains in order: L&R motor shaft angles, L&R motor currents, L&R motor voltages, L&R gearbox shaft angles, raw L&R encoder values, and raw L&R pot values |
| INS | 6 | rad/s, m/s2, deg/s, m/s2, deg/s m/s2 | Contains in order: Yaw rate, ax, roll rate, ay, pitch rate, & az |
| GPS | 28 | various | PPS, time of week, week num, Latitude, Longitude, Altitude, ECEF X, ECEF Y, ECEF Z, horizontal speed, vert velocity, course over ground, heading, roll angle, nav mode, attitude status, sats used, differential age, yaw stddev, roll stddev, horizontal rms, vertical rms, covariance N-N, covariance N-E, covariance N-U, covariance E-E, covariance E-U, covariance U-U |
| Handwheel | 3 | rad, rad, rad | Contains three separate handwheel angle measurements. |
| Accelerator | 1 | V | Contains the raw accelerator pedal signal. |
| Wheelspeeds | 4 | ticks/sample, ticks/sample, ticks/sample, ticks/sample | Contains wheelspeed in order data for FR, FL, RR, and RL wheels. |
| Commands | 8 | A, A, rad, rad, A, A, A, rad | Contains L&R steering motor current commands, L&R steering angle commands, L&R traction motor commands, & handwheel motor command, HAL command |
| SSest | 21 | rad, unitless, rad/s, rad/s, rad, unitless, rad/s, rad/s, m/s, m/s2, m/s, m/s2, m/s2, rad, m, m, time steps, time steps, unitless, unitless | Contains in order: 1) YAW angle, gyro sf, gyro bias, 4) rate; 5) ROLL angle, gyro sf, gyro bias, 8) rate; 9) LONGITUDINAL velocity, accel bias, 11) accel at CG; LATERAL velocity at CG, accel bias, 14) accel at CG; 15) SIDESLIP ANGLE; POSITION east (x), north (y); attitude flag, GPS delay; pos/vel flag, UPDATE pulse |
| Switches | 4 | bool, bool, bool, bool | Contains status of fault switch, HAL switch, cruise control switch, and brake pedal switch. |
| Load Cells | 4 | N, N, N, N | Contains front L&R tie rod load cell readings, rear L&R tie rod load cell readings. |
| Vehicle State | 7 | rad/s, rad, m/s, rad, rad/s, rad/s | Contains NON-GPS-BASED vehicle yaw rate, sideslip, horizontal speed, rear wheel speeds |
| PostProc | 5 | rad, rad, rad, Nm, Nm | Contains in order: left & right steer angles, ackermann angle, left & right steer torques measured by load cells |
| Tire Estimation | 12 | rad, rad, unitless, na, na, na, na, na, m, m, N, N | Contains in order: front slip angle, rear slip angle, tire-road friction coefficient, estimation flags, left & right pneumatic trail, left & right peak forces |
| Steering Torques | 10 | Nm, Nm, Nm, Nm, Nm, Nm, Nm, Nm, Nm, Nm | Contains in order: left & right aligning, Dalembert, Coulomb friction, damping, and jacking torques |
| Wheel Forces | 20 | N, N, N, N, N, N, Nm, Nm, Nm, Nm, Nm, Nm, RPM, RPM, deg, deg, m/s^2, m/s^2 | Contains in order: left & right Fx, Fy, Fz, Mx, My, Mz, wheel rotation rate, wheel rotation angle, wheel hub ax, wheel hub ay |
Data Files
Experimental data, organized by date in reverse chronological order. Open "Summary of Tests" for any given date for a summary that includes the researchers' notes from each test, the maximum speed, the peak lateral acceleration, and the total test length. Tests older than 7.18.2018 are without upgraded GPS and installed wheel force transducers.
6.12.2019
Variety of friction measurement tests with constant radius circles and stationary steering sweeps, both on clean asphalt and on corn-covered asphalt to compare results from stationary and moving tests.- Summary of Tests
- craig_2019-06-12_aa.mat
- craig_2019-06-12_ab.mat
- craig_2019-06-12_ac.mat
- craig_2019-06-12_ad.mat
- craig_2019-06-12_ae.mat
- craig_2019-06-12_af.mat
- craig_2019-06-12_ag.mat
- craig_2019-06-12_ah.mat
- craig_2019-06-12_ai.mat
- craig_2019-06-12_aj.mat
- craig_2019-06-12_ak.mat
- craig_2019-06-12_al.mat
- craig_2019-06-12_am.mat
5.17.2019
Steering sweeps (ramps) at various steering rates a very slow speeds (0.2 and 1.0 m/s) to excite steering torques while rolling. Includes both clean and corn-covered asphalt conditions. Repeat of previous data with better alignment.- Summary of Tests
- beal_2019-05-17_aa.mat
- beal_2019-05-17_ab_corrected.mat
- beal_2019-05-17_ab.mat
- beal_2019-05-17_ac.mat
- craig_2019-05-17_aa.mat
- craig_2019-05-17_ab.mat
- craig_2019-05-17_ac.mat
- craig_2019-05-17_ad.mat
- craig_2019-05-17_ae.mat
- craig_2019-05-17_af.mat
- craig_2019-05-17_ag.mat
- craig_2019-05-17_ah.mat
- craig_2019-05-17_ai.mat
- craig_2019-05-17_aj.mat
- craig_2019-05-17_ak.mat
- craig_2019-05-17_al.mat
- craig_2019-05-17_am.mat
- craig_2019-05-17_an.mat
- craig_2019-05-17_ao.mat
- craig_2019-05-17_ap.mat
- craig_2019-05-17_aq.mat
- craig_2019-05-17_ar.mat
- craig_2019-05-17_as.mat
- craig_2019-05-17_at.mat
- craig_2019-05-17_au.mat
- craig_2019-05-17_av.mat
- craig_2019-05-17_aw.mat
- craig_2019-05-17_ax.mat
- craig_2019-05-17_ay.mat
- craig_2019-05-17_az.mat
- craig_2019-05-17_ba.mat
5.6.2019
Steering sweeps (ramps) at various steering rates and very slow speeds (0.2 and 1.0 m/s) to excite steering torques while rolling. Includes both clean and corn-covered asphalt conditions.- Summary of Tests
- beal_2019-05-06_aa.mat
- beal_2019-05-06_ab.mat
- beal_2019-05-06_ac.mat
- beal_2019-05-06_ad.mat
- beal_2019-05-06_ae.mat
- beal_2019-05-06_af.mat
- beal_2019-05-06_ag.mat
- beal_2019-05-06_ah.mat
- beal_2019-05-06_ai.mat
- beal_2019-05-06_aj.mat
- beal_2019-05-06_ak.mat
- beal_2019-05-06_al.mat
- beal_2019-05-06_am.mat
- beal_2019-05-06_an.mat
- beal_2019-05-06_ao.mat
- beal_2019-05-06_ap.mat
3.20.2019
Steering sweeps (ramps) at various steering rates and very slow speeds (0.2 and 1.0 m/s) to excite steering torques while rolling. Tests combined into triplets with three different maneuvers in each, all on clean asphalt. Alignment may be at issue.12.12.2018
Steering maneuvers (combination of sinusoids) while vehicle was kept stationary. Includes dry concrete, wet concrete, 1 cm sheet ice, and layer of ice cubes as test surfaces.9.20.2018
Steering sweeps (done by hand) while vehicle was kept stationary. Includes dry and corn-covered asphalt and dry concrete.8.16.2018
Dynamic tests on a skidpad with a low-friction patch, including straight-line toe-in maneuvers as well as constant radius handling tests with split-mu and whole car low friction events.8.09.2018
Experiments on paved road with toe-in and toe-out during mostly straight-line driving.7.19.2018
Dynamic tests on a skidpad, including straight-line driving, standard handling tests (ramp steer, constant radius - increasing speed), laps around a banked loop, and random steering excitation.- Summary of Tests
- craig_2018-07-19_aa.mat
- craig_2018-07-19_ab.mat
- craig_2018-07-19_ac.mat
- craig_2018-07-19_ad.mat
- craig_2018-07-19_ae.mat
- craig_2018-07-19_af.mat
- craig_2018-07-19_ag.mat
- craig_2018-07-19_ah.mat
- craig_2018-07-19_ai.mat
- craig_2018-07-19_aj.mat
- craig_2018-07-19_ak.mat
- craig_2018-07-19_al.mat
7.18.2018
A series of stationary tests with the car on turn plates, steering back and forth to identify rotations of the wheel force transducers relative to the vehicle coordinate system.8.24.2016
8.4.2015
Additional test data (with older, less accurate sensing) available by request.